
DS203
USER’S MANUAL

2
Contents
I Product Intro………………………………………………………………………………………..…….2
II General Safety Rules ……………………………………………………………………………….. 2
III Major Functions ……………………………………………………………………………………..2
IV Operation Precautions …………………………………………………………………………………..2
V General Inspection …………………………………………………………………………………. 3
VI Functional Inspection................................................................................................................................ 3
VII Firmware Upgrade …………………………………………………………………………………….3
VIII Oscilloscope Familiarization…………………………………………………………………………. 4
1. Interface and Buttons…………………………………………………………………………………4
2. Screen………………………………………………………………………………………………5
2.1.Parameters…………………………………………………………………………………………5
2.2.Functions of Channel Area…………………………………………………………………………6
2.3.Functions of Detection Area…………………………………………………………………….7
2.4.Menus…………………………………………………………………………………………. 8
IX Application Example…………………………………………………………………………………….9
1. Example 1 Measure simple signals…………………………………………………………………9
2. Example 2 Acquire a single signal…………………………………………………………………9
3. Example 3 Measure with Cursors…………………………………………………………………10
4. Example 4 Compare waveforms……………………………………………………………………11
5. Example 5 Save waveform images…………………………………………………………………12
X Operation Tips…………………………………………………………………………………………13

3
I Product Intro
DS203 is a 5-trace 4-channel digital oscilloscope for common electronic engineering tasks. Its CPU is
based on ARM Cortex M3, adopting FPGA to manage the control & data buffering of ADC. A built-in 2MB USB
disk enables users to store waveforms & upgrade firmware. It also provides 4 application areas, convenient for
users to load & upgrade at most 4 kinds of application firmware.
II General Safety Rules
To ensure your safety & avoid any damage to the device/connected products, please read the following
precautions carefully. To avoid any possible dangers, please use this product according to the rules.
Avoid fire & physical injury.
Use appropriate power cord. Please use dedicated power cord which is certified in the country/region.
Connect & disconnect properly. Do not plug/unplug when the probe(s)/test lead(s) is connected to the
voltage source. Before you plug/unplug current probes, please disconnect power to the circuit-under-test.
Observe all terminal ratings. To avoid fire/electric shock, please observe ratings & symbols on the
product. Please read the user’s manual carefully to know detailed info of the ratings before connecting the device.
Do not operate in humid environment.
Do not operate in inflammable/explosive environment.
Please keep the surface of the product clean & dry.
III Major Functions
Pocket-size oscilloscope DS203 helps you test, adjust & present electronic designs. Its functions include:
▼ 8M Hz bandwidth,8-bit precision
▼ 2 analog channels: (CH_A, CH_B), 2 digital channels (CH_C, CH_D)
▼ Calculation channels: [CH_A]+[CH_B], [CH_A]-[CH_B], [CH_C]|[CH_D],
[CH_C]&[CH_D],REC_A, REC_B, REC_C, REC_D
▼ Sampling rate of any analog channel can reach 72 MS/s
▼ Record length of any channel can reach 4096 bits
▼ Users can save waveforms and upgrade firmware with a built-in 2M USB disk.
IV Operation Precaution
▌Temperature:
Operating Condition:+0°C to +50°C
Non-operating Condition:-20 °C to +60 °C
▌Humidity:
Operating Condition:high temperature:40 °C to 50 °C,0% to 60% RH
Operating Condition:low temperature:0 °C to 40 °C,10 to 90%RH
Non-operating Condition:high temperature:40 °C to 60 °C,5 to 60% RH
Non-operating Condition:low temperature:0 °C to 40 °C,5 to 90% RH
▌Parameters
Max transient-withstanding voltage is ± 400 V peak value.
Measure voltage range
Measure frequency range
Max input voltage of logic probe is ±15 V peak value.

4
V General Inspection
When you get a new DS203 oscilloscope, it’s suggested to inspect the product by following steps.
1.Inspect for damage caused by shipping.
If the packaging carton or protection pad is seriously damaged, keep the package until you check the
oscilloscope & accessories electrically and mechanically.
2.Inspect the oscilloscope
Please contact us if following problems occur: (1) surface of device is damaged; (2) device can’t work well;
(3) device doesn’t pass performance test
If damage is resulted from shipping, please keep the container & inform the shipping department/others
responsible for this service.
VI Functional Inspection
Make a quick functional inspection to ensure this device works well. Please perform following steps:
1. Turn on power supply; access the homepage of the oscilloscope.
2. Connect the oscilloscope with standard signals (e.g.: square wave 20KHz, Vpp=5V); Set the switch on
probe tip as 1X, plug oscilloscope probe to CH_A.
Check whether the measured values are consistent with standard values. It can be calibrated if the margin is
narrow. Same for CH_B, CH_C & CH_D.
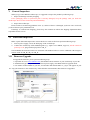
VII Firmware Upgrade
To upgrade the firmware, please perform following steps:
1. Open Web to access www.minidso.com, download the latest firmware of your oscilloscope to your PC.
2. Simultaneously press || of DS203 and turn on power supply, enter DFU firmware upgrade mode.
3. Use USB to connect DS203 to your PC, A removable disk named “DFU V3_10_D” will appear on your
PC. Copy the firmware to the root directory of this disk then restart DS203, thus firmware is upgraded.

5
VIII Oscilloscope Familiarization
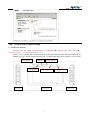
1. Interfaces & buttons.
Front view, left→right: RUN/HOLD(||), CALIBRATE (■), PRESET (●), SAVE WAVE(▲)、
NAVIGATOR A(―…+), NAVIGATOR B(…).
Left view, top→bottom:Wave output[WAVE OUT],analog channel B[CH_B], analog channel A[CH_A].
Right view, top→bottom: Digital channelC [CH_C], digital channelD [CH_D], USB port, power switch.
----------------------------------------------------------------------------------------------------------------------
front view left view
right view
RUN/HOLD PRESET
SAVE WAVE
CALIBRATE
NAVIGATOR A NAVIGATOR B

6
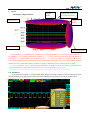
2. Screen
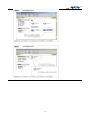
The display is depicted below:
Horizontally A—I is channel area; vertically J—T is measurement area. You can move cursor within A—G
by scrolling (…); change selection by scrolling (―…+); move cursor between upper & lower menus by
pressing (―…+). When cursor is in G Position, press (―…+) to move it within G—I; and press (▲) to move
cursor between channel area & measurement area. Each menu has the same color as its corresponding channel:
Channel A ( blue), Channel B( yellow), Channel C( purple), Channel D( green), Common menu is orange.
U—X is parameter area, U position shows parameters for THR, V1 & V2 to choose; V position is the
preferred parameter of (●) button; W position is
△
T=T2-T1, X position is
△
V=V1-V2
---------------------------------------------------------------------------------------------------------------------
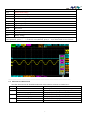
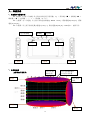
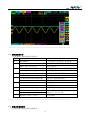
2.1、Parameters
As in figure below, adjust G—I,output 1KHz from [WAVE OUT],input square waveform of 50% duty factor
into CH_B,Short press (●) to display current parameter.Annotations of parameters are shown in table below:
Display the position
of current waveform
Trigger
point
cache
depth
Channel Area
Parameter Area
Measurement Area

7
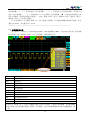
FPS Frames Per Second
Vpp Peak-to-Peak Voltage
Vdc Direct Current Voltage
RMS Average Value of Voltage
Max Maximum Voltage
Min Minimum Voltage
FRQ Signal Frequency
CIR Signal Cycle
DUT Duty factor
TH Monocycle High Level Time
TL Monocycle Low Level Time
Vbt Battery Voltage
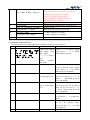
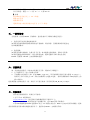
There are 12 parameters; Short press(●) shows only 8 parameters; Press(●)longer and scroll (―…+)to
select parameter, press (―…+) to choose color (channel), press (…)or choose EXT to exit; as below:
---------------------------------------------------------------------------------------------------------------------
2.2. Functions of Channel Area
The table below shows the detailed introduction of the functions of menus in channel area:
Menu Item
Function(Operate: Scroll(―…+))
A
RUN/HOLD
(Running Mode
)
RUN/HOLD, show voltage
B AC/DC/-- (Channel A)AC coupling/DC coupling/hide
50mV—10V (stepping in 1-2-5mode)
voltage per grid
C
AC/DC/--
(Channel B)AC coupling/DC coupling/hide
50mV—10V
(
stepping in 1-2-5mode
)
voltage per grid
D
DC/--
(Channel C) DC coupling/hide
--
----

8
E CH_(D)/(A+B)/(A-B)/(C&D)/(C|D)/
REC_A/ REC_B/ REC_C/ REC_D
thru CH_D: Input(A+B), waveforms of CH_A & CH_B sync
(A-B): get subtraction of waveforms of CH_A & CHA_B
(C&D): get and operation of CH_C & CH_D
(C|D): get or operation of CH_C & CH_D
REC_A: reload the last waveform saved in CH_A
Same for REC_B, REC_C & REC_D
--
-----
F
AUTO/NORM/
(Trigger M)Auto/Norm/Sgl/slow scan/instant scan
0.1uS—1S
(
stepping in 1-2-5 mode
)
Unit per second
G
Squ/Sin/Tri/Saw(≈2.8Vpp)
(Waveform output)squ/sin/tri/sawtooth
H (Squ)10Hz—8MHz
﹤1MHz, stepping in 1-2-5mode
﹥1MHz, stepping in 2-4-6-8mode
(Sin/Tri/Saw) 10Hz—20KHz
I
(Squ)50%—90%(±10%)
adjust duty factor
---------------------------------------------------------------------------------------------------------------------
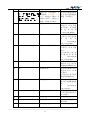
2.3、Functions of Detection Area
The table below shows detailed illustrations of functions of menus in detection area:
Menu
Item Function Operating Instruction
J
Trigger mode: falling
edge trigger, rising
edge trigger, (>, <)
trigger, (<, >) negative
pulse
width,(<, >)positive
pulse width
Scroll(―… + ) to choose trigger
mode, press (―… + ) to choose
channel (different colors)
K THR Trigger level
Scroll (―…+ ) to adjust trigger
level (U position shows trigger
level), press (―…+ ) to choose
channel (CH_A/CH_B/hide)
L V1 Cursor V1: top limit
of visible trigger level
Scroll (―…+) to select top limit of
trigger level, and press (―…+) to
choose channel(CH_A/CH_B/
CH_C/CH_D/hide)
M V2 Cursor V2: bottom
limit of visible trigger
level
Scroll (―… + ) to adjust bottom
limit of trigger level(in X position,
shows △V=V1-V2), press (―…+)
to choose channel (CH_A/CH_B/
CH_C/CH_D/hide)
N T1 Time Maker T1
Scroll (―…+) to adjust time maker
T1, and press (―…+) to hide time
marker
O T2 Time Marker T2
Scroll (―…+) to adjust time maker
T2 (in W position shows
△
T=T1-T2), press (―…+) to hide
time marker T2.
P Y Horizontal Level of
Scroll(―…+ )to adjust horizontal

9
each channel
level, press(―… + ) to choose
channel(CH_A/CH_B/CH_C/CH_D)
Q X Choose the window to
display waveforms
Scroll(―…+) to choose waveforms
of different positions to display on
current window
R T0
????? ???????
S 360-4K Memory depth
Scroll (―…+) to choose memory
depth
T EXT/SAV
??????? ????????
---------------------------------------------------------------------------------------------------------------------
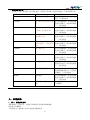
2.4、Menus
On screen, press (■) to access the menu, press again to exit. Detailed instructions are listed below:
Item(Up→Down)
Function Operating Instruction
Save Param Save current parameter settings
Press (―…+) to confirm,
scroll (…) to the next menu
Save Dat Save dat file to the built-in USB
disk
Press (―… +
) to confirm,
scroll (―…+) to choose file
no., scroll (…) to next menu
Save Buf Save buf file (sample data in
buffering area) to built-in USB
disk
Press (―… + ) to confirm,
scroll (―…+) to choose file
no., scroll (…) to next menu
Save Bmp Save bmp file (waveform
image) to the built-in USB disk.
Press (―… + ) to confirm,
scroll (―…+) to choose file
no., scroll(…) to next menu.
Save Csv Save csv file (export sampling
data of buffering area) to
built-in USB disk
Press (―… + ) to confirm,
scroll (―…+) to choose file
no., scroll(…) to next menu.
Load Dat Load dat file
Press (―… + ) to confirm,
scroll (―…+) to choose file
no., scroll (…)to next menu.
Load Buf Load buf file
Press (―… + ) to confirm,
scroll (―…+) to choose file
no., scroll (…)to next menu.
BackLight Adjust backlight brightness
Press (―… + ) to confirm,
scroll (―… + ) to adjust
backlight brightness, scroll
(…) to next menu.
Buzzer Adjust buzzer volume
Press (―… + ) to confirm,
scroll (―…+) to adjust buzzer
volume, scroll (…) to next
menu.
Standby Choose screensaver
Press (―… + ) to confirm,
scroll (―…+) to choose file
no., scroll (…) to next

10
menu.
Calibrat Instrument calibration (make
sure CH_A is ground connected)
Press (―…+) to confirm, press
(■) to calibrate.
IX Application Examples:
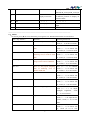
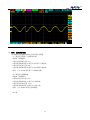
1. Example One:Measure simple signals
Observe one unknown signal in a circuit, measure & display the frequency & peak-to-peak value of the signal.
Please operate according to following steps:
Connect the probe of CH_A/CH_B to the detection point of the circuit.
Set CH(A)/CH(B) as AUTO mode, DC coupling, adjust the(horizontal) time calibration and (vertical) voltage
calibration, make sure the signal displays clearly.
Adjust THR value to make the display of signals stable.
Press(●), analyze signal parameters, e.g.:Vpp(peak-to-peak voltage), RMS(average value of
voltage),FRQ(frequency) and so on.
Take the following figure as an example:
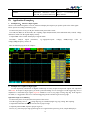
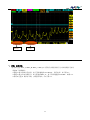
2. Example Two: Acquire a single signal
It’s the superiority and feature of digital oscilloscope to easily acquire non-periodic signals like impulsion
and sentus. To acquire a single signal, you need a priori knowledge of it to set trigger level & trigger edge. E.G. if
impulsion is a TTL PWL logic signal, trig level should be set as 2V, trig edge as rising edge trig. If the signal is
not stable, it’s suggested to observe in a normal triggering mode to define trig level & trig edge.
Operation steps are as follows:
Connect the probe of CH_B to detection point of the circuit.
Set the triggering: set J as (rising edge trig), F as SINGL(single trig), trig setting: DC coupling.
Adjust horizontal time level and vertical scale to proper range.
Adjust K position THR, adjust to proper trig level.
Press (||), wait for proper trig signal to appear. If a signal reaches preset trig level, sample & display it.

11
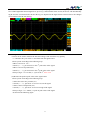
This function can catch occasional incidents very easily; e.g. a sudden sentus of high amplitude. Set the trig
level a little higher than normal signal level, press (||), and when the sentus occurs, the device will automatically
trig & store the waveforms before & after the trig. It’s depicted as the figure below to better observe the changes
of waveforms before & after the trig.
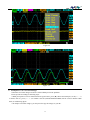
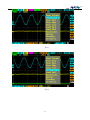
3. Example Three: Cursor measurements
A cursor can be used to measure the time and voltage of the waveform very quickly.
(1)Measure the cycle of the 3
rd
waveform from the signal source.
Please operate according to the following steps:
Move cursor to N(T1)。
Scroll (―…+), put cursor T1 to the 3
rd
peak value of the signal.
Move cursor to N position (T2).
Scroll (―…+), put cursor T2 to the 4
th
peak value of the signal.
Then you’ll get:
△
T=14.0uS, i.e. cycle of the 3
rd
wave crest.
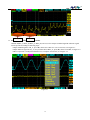
(2) Measure the peak-to-peak value of the signal source
Please operate according to the following steps:
Move the cursor to L position (V1)
Scroll (―…+), put cursor V1 to wave crest of the signal.
Move cursor to M position (V2)
Scroll (―…+), put cursor V2 to wave trough of the signal.
Then you’ll get:
△
V=168mV, i.e. peak-to-peak value of the signal
As shown in the following figure

12
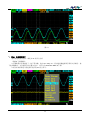
4. Example Four: Comparison of Waveforms
Module E(REC_A/ REC_B/ REC_C/ REC_D) can be used to compare standard signal & unknown signal.
Please operate according to following steps:
Input standard signal to CH_A, press (■), choose Save Dat 01 to save waveform, as in Figure 4.1:
Input unknown signal to CH_ A, in E position choose REC_A, press (■), choose Load Dat, as Figure 4.2:
Move P position Y to adjust horizontal level, to compare waveforms, as in Figure 4.3:
Figure 4.1
Vpp Cycle

13
Figure 4.2
Figure 4.3
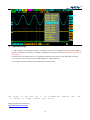
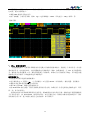
5. Example Five: Save waveform images
Sometimes waveform images need to be archived/analyzed on PC platform.
Please operate according to following steps:
With prerequisite of correct measurement of signal source, press (■), choose Save Bmp 01, scroll (―…+)
to choose file no., press (―…+) to confirm. The file (named IMAG001.BMP) will be saved to built-in USB
disk; as in following figure.
To analyze waveform images, you only need to copy the images to your PC.

14
X Operation Tips
1. When measure high frequency signals, to enhance scan speed, it’s suggested to lower buffer depth by
adjusting S position, 360 points as a window, and adjust X in Q position to observe the buffer waveforms in
the memory.
2. After access to the signal, choose AC coupling scale when need to observe noise and ripple waveform.
3. Use cursor V1 & V2 to measure two random points for voltage difference.
4. Use cursor T1 & T2 to measure two random points for time differ
The content on this Web site is for informational purposes only, and
is subject to change, without prior notice.
http://shop36212219.taobao.com
http://meishun88.taobao.com

15
DS203 用户手册 (app_yijian)
目录
一、产品简介………………………………………………………………………………..…….2
二、常规安全概要 ……………………………………………………………………………….. 2
三、主要功能 ……………………………………………………………………………………..2
四、操作注意事项 ………………………………………………………………………………..2
五、一般性检查 …………………………………………………………………………………. 3
六、功能检查 .................................................................................................................................. 3
七、升级固件 …………………………………………………………………………………….3
八、熟悉仪器 ……………………………………………………………………………………. 5
1、仪器接口与按键介绍………………………………………………………………………5
2、主屏幕介绍…………………………………………………………………………………5
2.1、参数键参数介绍…………………………………………………………………………6
2.2、通道区功能介绍…………………………………………………………………………7
2.3、检测区区功能介绍……………………………………………………………………….7
2.4、菜单键菜单介绍…………………………………………………………………………. 9
九、应用实例…………………………………………………………………………………….9
1、例一:测量简单信号………………………………………………………………………9
2、例二:捕捉单次信号………………………………………………………………………10
3、例三:应用游标测量………………………………………………………………………11
4、例四:波形对比……………………………………………………………………………12
5、例五:保存波形图片………………………………………………………………………14
十、操作小技巧……………………………………………………………………………………15

16
一、产品简介
DS203 是一个 5 踪 4 线的通用电子工程任务的数字示波器。它的基于 ARM Cortex M3 内核的 CPU,
采用 FPGA 实现对外接 ADC 的管理控制和数据缓存,内置 2MB 的 U 盘,用户可以通过 U 盘来存储波形和升
级系统固件,并提供 4 个应用程序分区,方便用户装载和升级最多 4 个不同的应用程序固件。
二、常规安全概要
详细阅读下列安全性预防措施,以避免人身伤害,并防止损坏本产品或与本产品连接的任何产品。
为避免可能的危险,请务必按照规定使用本产品。
避免火灾或人身伤害。
使用合适的电源线。 请只使用本产品专用并经所在国家/地区认证的电源线。
正确连接并正确断开连接。探头或测试导线连接到电压源时请勿插拔,连接电流探头或断开电流探
头的连接之前请将被测电路断电。
遵守所有终端额定值。为避免火灾或电击,请遵守产品上的所有额定值和标记。在对产品进行连接
之前,请首先查阅产品手册,了解有关额定值的详细信息。
请勿在潮湿环境下操作。
请勿在易燃易爆的环境中操作。
请保持产品表面清洁干燥。
三、主要功能
袖珍示波器 DS203 可以帮您验证、调试和表征电子设计。主要功能包括:
▼ 8M Hz 带宽,8 位精确度
▼ 两个模拟通道(CH_A、CH_B),两个数字通道(CH_C、CH_D)
▼ 运算通道数[CH_A]+[CH_B], [CH_A]-[CH_B], [CH_C]|[CH_D], [CH_C]&[CH_D],REC_A,
REC_B, REC_C, REC_D
▼ 所有模拟通道上的取样速率高达 72 MS/s
▼ 所有通道上的记录长度均为 4096 点
▼ 用户可通过内置 2M 的 U 盘存储波形和升级系统固件
四、操作注意事项
▌温度:
工作状态:+0°C 到+50°C
非工作状态:-20 °C 到 +60 °C
▌湿度:
工作状态:高温:40 °C 到 50 °C,0% 到 60% RH
工作状态:低温:0 °C 到 40 °C,10 到 90%RH

17
非工作状态:高温:40 °C 到 60 °C,5 到 60% RH
非工作状态:低温:0 °C 到 40 °C,5 到 90% RH
▌参数
最大瞬时承受电压是 ± 400 V 峰值。
测量电压范围
测量频率范围
逻辑探头输入处的最大输入电压为 ±15 V 峰值。
五、一般性检查
当您得到一台新的 DS203 示波器时,建议您按以下步骤对仪器进行检查。
1.检查是否存在因运输造成的损坏。
如果发现包装纸箱或泡沫塑料保护垫严重破损,请先保留,直到整机和附件通过电
性和机械性测试。
2.检查整机。
如果发现仪器外观破损,仪器工作不正常,或未能通过性能测试,请和公司联系。
如果因运输造成仪器的损坏,请注意保留包装。通知运输部门和负责此业务的
RIGOL 经销商。RIGOL 会安排维修或更换。
六、功能检查
做一次快速功能检查,以核实本仪器运行正常。请按如下步骤进行:
3. 打开电源开关,进入示波器主页面。
4. 示波器接入标准信号(如:方波 20KHz,Vpp=5V), 用示波器探头将信号接入通道 A(CH_A) :
将探头上的开关设定为 1X,并将示波器探头与通道 A 连接。 将探头插槽对准 CHA 插接件上的
插口并插入。
检验测量值与标准值是否一致,相差不大可进行校准,同理可检测 CH_B, CH_C, CH_D。
七、升级固件
要升级示波器的固件,请执行以下操作:
1.打开 Web 浏览器访问
www.minidso.com,将适用的示波器最新固件下载到 PC 上。
2.按下 DS203 的 || 键并同时按下电源键开机,进入 DFU 固件升级模式。
3.用 USB 数据线将 DS203 连接到 PC 机上,PC 机将出现名为:DFU V3_10_D 的可移动硬盘,把准
备好的固件拷贝到该移动硬盘的根目录下,重新启动 DS203,完成固件升级。

18

19
八、熟悉仪器
1、仪器接口与按键介绍
、正面图,上方有六个按键,从左到右依次是运行/暂停键( || )、菜单键( ■ )、参数键( ● )、
跳转键( ▲ )、选项键( ―…+ )、移动键(…)。
、左视图,有三个通道,从上到下依次是波形输出[ WAVE OUT ]、模拟通道 B[ CH_B ]、模拟
通道 A[ CH_A ]。
、右视图,从上到下依次是数字通道 C[ CH_C ]、数字通道 D[ CH_D ]、USB 接口、电源开关。
----------------------------------------------------------------------------------------------------------------------
2、主屏幕介绍
主屏幕如下图所示:
显示当前波形窗口
在内存中的位置
内 存 中 的
触发位置
内 存 缓 存
深度
通道区
参数区
测量区
正面图 左视图 右视图
运行/暂停键 参数键 选项键
菜单键 跳转键 移动键

20
横向 A—I 选项是通道区,纵向 J—T 是测量区,滚动移动键(…)可使光标在 A—G 之间移动,
滚动选项键( ―…+ )可更改选项,按下选项键( ―…+ )可使光标在上下层菜单跳转,当光标在 G
处时,按下选项键( ―…+ )可使光标在 G—I 之间跳转,按下跳转键( ▲ )可使光标在通道区与测
量区之间跳转,各菜单选项颜色与通道一 一对应,通道 A 菜单(蓝色)、通道 B(黄色)、通道 C(紫色)、
通道 D(绿色),公共菜单用橙色。
U—X 是参数区,U 位置是 THR、V1、V2 可选显示的参数,V 位置是参数键首选项显示参数,W 位
置是△T=T2-T1,X 位置是△V=V1-V2
---------------------------------------------------------------------------------------------------------------------
2.1、参数键参数介绍
如下图所示,调节 G—I,使波形输出[ WAVE OUT ]通道输出 1KHz,占空比 50%的方波,接入通道
B(CH_B),按下参数键(短按),显示当前参数,参数注释如下表:
FPS
每秒扫描波形帧数
Vpp
电压峰峰值
Vdc
直流电压
RMS
电压平均值
Max
电压最大值
Min
电压最小值
FRQ
信号频率
CIR
信号周期
DUT
占空比
TH
单周期高电平时间
TL
单周期低电平时间
Vbt
电池电压
总共有 12 个参数,按下(短按)参数键只能显示其中 8 位参数,可通过长按参数键,滚动选项键选
择显示参数,按下选项键可选择不同颜色(不同通道),按下移动键或选择 EXT 按下选择键退出,如
下图:
ページが読み込まれています...
ページが読み込まれています...
ページが読み込まれています...
ページが読み込まれています...
ページが読み込まれています...
ページが読み込まれています...
ページが読み込まれています...
ページが読み込まれています...
ページが読み込まれています...
-
 1
1
-
 2
2
-
 3
3
-
 4
4
-
 5
5
-
 6
6
-
 7
7
-
 8
8
-
 9
9
-
 10
10
-
 11
11
-
 12
12
-
 13
13
-
 14
14
-
 15
15
-
 16
16
-
 17
17
-
 18
18
-
 19
19
-
 20
20
-
 21
21
-
 22
22
-
 23
23
-
 24
24
-
 25
25
-
 26
26
-
 27
27
-
 28
28
-
 29
29


他の言語で
- English: kuman DS203 User manual
その他のドキュメント
-
Rigol PCA1030&PCA2030&PCA1150_UserGuide_CN&EN ユーザーマニュアル
-
-
Philips DTD3190/98 取扱説明書
-
-
-
Rigol DG4062 クイックスタートガイド
-
Tektronix MDO3014 Installation And Safety Instructions
-
UNI-T UT-P40 AC DC Current Probe ユーザーマニュアル
-
-
Tektronix MSO 5 Series Installation And Safety Manual